
qPCR mRNA (ΔΔCt)
One-line: relative mRNA expression by ΔΔCt, from raw Ct CSV to publication-ready bar plots — one per target gene.
Get this skill · 获取本技能
Option A — one-click agent prompt (recommended). Copy this into your AI agent IDE:
Please set up the "qpcr-mrna" skill from the Claw2Bio library for me:
1. Fetch only the folder "experiment-data/qpcr-mrna" from the GitHub repo
   https://github.com/nihuanhe/claw2bio (use sparse checkout; do not clone the whole repo).
2. Read its SKILL.md and register the skill.
3. Run the bundled example in examples/ to verify my environment, and show me the output figure.
Option B — standalone zip (~0.2 MB, served from this site): https://claw2bio.site/downloads/qpcr-mrna.zip
Option C — full example dataset: already included in the Option B package above.
What it does
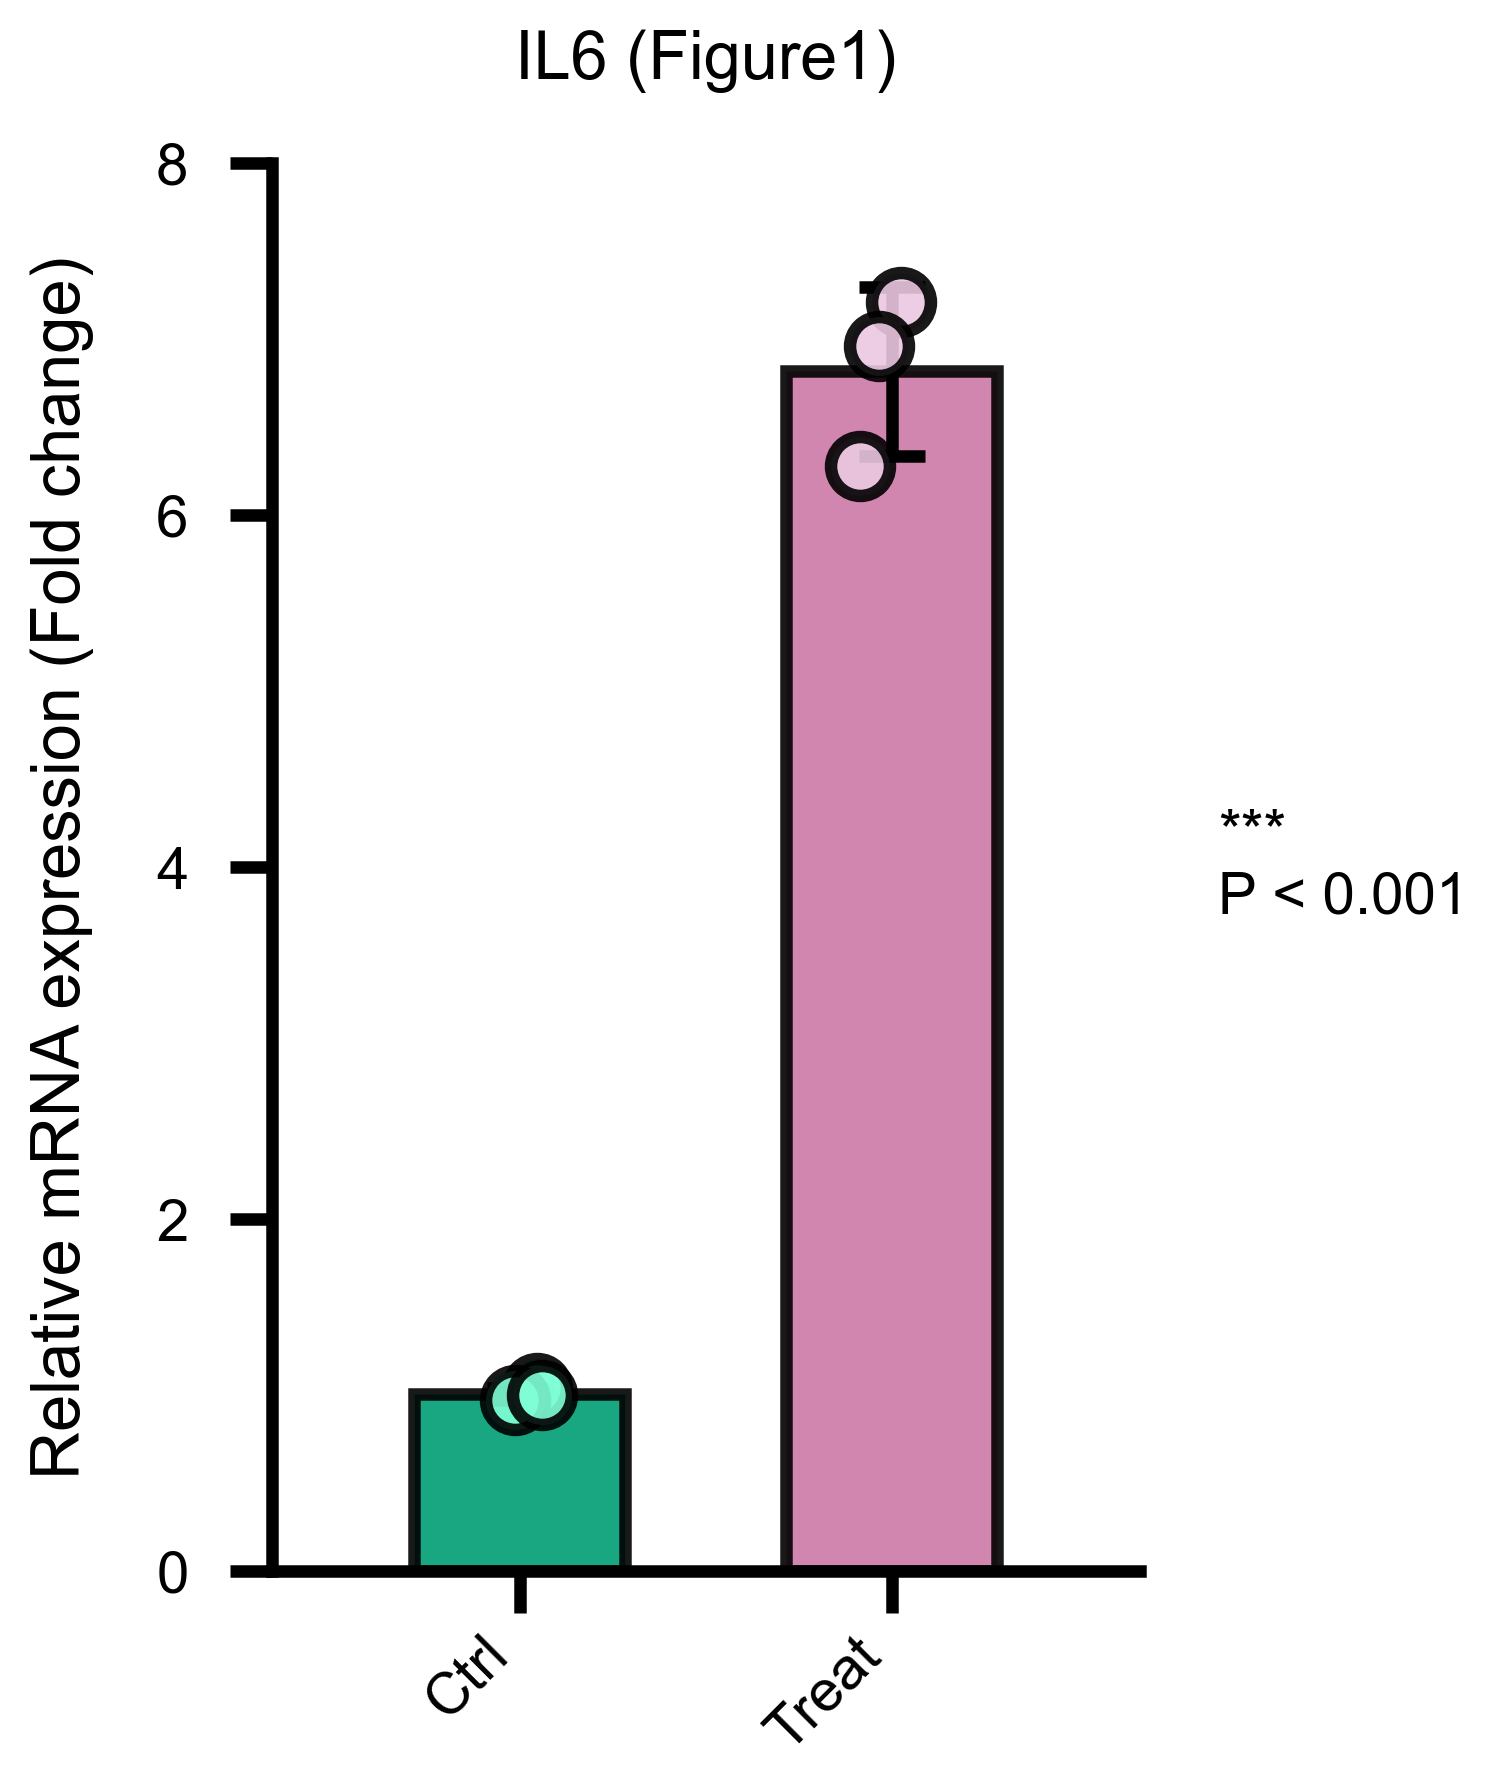
Given a raw qPCR Ct table (Target, Sample, Rep1, Rep2, Rep3), the skill normalizes each target to reference genes (default GAPDH), computes ΔΔCt and fold change against the control group, runs the right statistics (2 groups: t-test; ≥3 groups: ANOVA + Dunnett), and draws one 300-dpi bar plot per target gene:
Quick start (30 seconds)
After your agent has fetched the skill (Get-this-skill box above), just say:
Run the qpcr-mrna example and show me the figure.
Or manually:
cd experiment-data/qpcr-mrna
pip install pandas numpy scipy matplotlib
python scripts/run_mrna.py examples/input/mrna-input.csv examples/output --name Figure1 --overwrite
You should get Figure1.csv plus one Figure1_<target>_barplot.png per target (IL6 ~6.8× up, P<0.001).
Input format
Target,Sample,Rep1,Rep2,Rep3
IL6,Ctrl,20.10,20.30,20.20
IL6,Treat,17.50,17.80,17.60
GAPDH,Ctrl,18.00,18.10,18.05
GAPDH,Treat,18.20,18.30,18.25- Reference-gene rows look like any other target row; the first
Samplebecomes the control group. - 2–6 groups supported (extended layout beyond that).
Output files
| File | Content |
|---|---|
<name>.csv | Raw Ct + ΔCt + fold change + P value + significance |
<name>_<target>_barplot.png | One 300-dpi plot per target gene |
Parameters
| Flag | Default | Description |
|---|---|---|
--name | — | Output file prefix |
--ref-targets | GAPDH | Reference genes, comma-separated |
--control | first Sample | Control group name |
--y-label | — | Y-axis label |
--dpi | 300 | PNG resolution |
--overwrite | off | Allow overwriting existing outputs |
Troubleshooting
- "Output file exists" → add
--overwrite, or change--name. - Reference gene not detected → check the target name spelling, or pass
--ref-targets ACTB. - ModuleNotFoundError → ask your agent to install the dependencies, or run
pip install pandas numpy scipy matplotlib. - Why must the agent run the bundled scripts instead of writing its own? The scripts in
scripts/are the tested path — they have been run on the example data, and their edge cases are documented. Code generated on the fly by an agent is the most common source of silently wrong results. If a case is not covered, change the CLI arguments first; if that is not enough, copy a script to a scratch directory and make a minimal, reported edit; only write new code when nothing covers the task, and fold it back intoscripts/afterwards.
Links
- Source & SKILL.md on GitHub
- Related skills: qPCR mtDNA · Grouped bar plot