
Grouped Bar Plot
One-line: wide-format CSV in — publication-ready grouped bar plot out, with error bars, scatter points and significance annotations.
Get this skill · 获取本技能
Option A — one-click agent prompt (recommended). Copy this into your AI agent IDE:
Please set up the "barplot" skill from the Claw2Bio library for me:
1. Fetch only the folder "figure-generation/barplot" from the GitHub repo
   https://github.com/nihuanhe/claw2bio (use sparse checkout; do not clone the whole repo).
2. Read its SKILL.md and register the skill.
3. Run the bundled example in examples/ to verify my environment, and show me the output figure.
Option B — standalone zip (~0.6 MB, served from this site): https://claw2bio.site/downloads/barplot.zip
Option C — full example dataset: already included in the Option B package above.
What it does
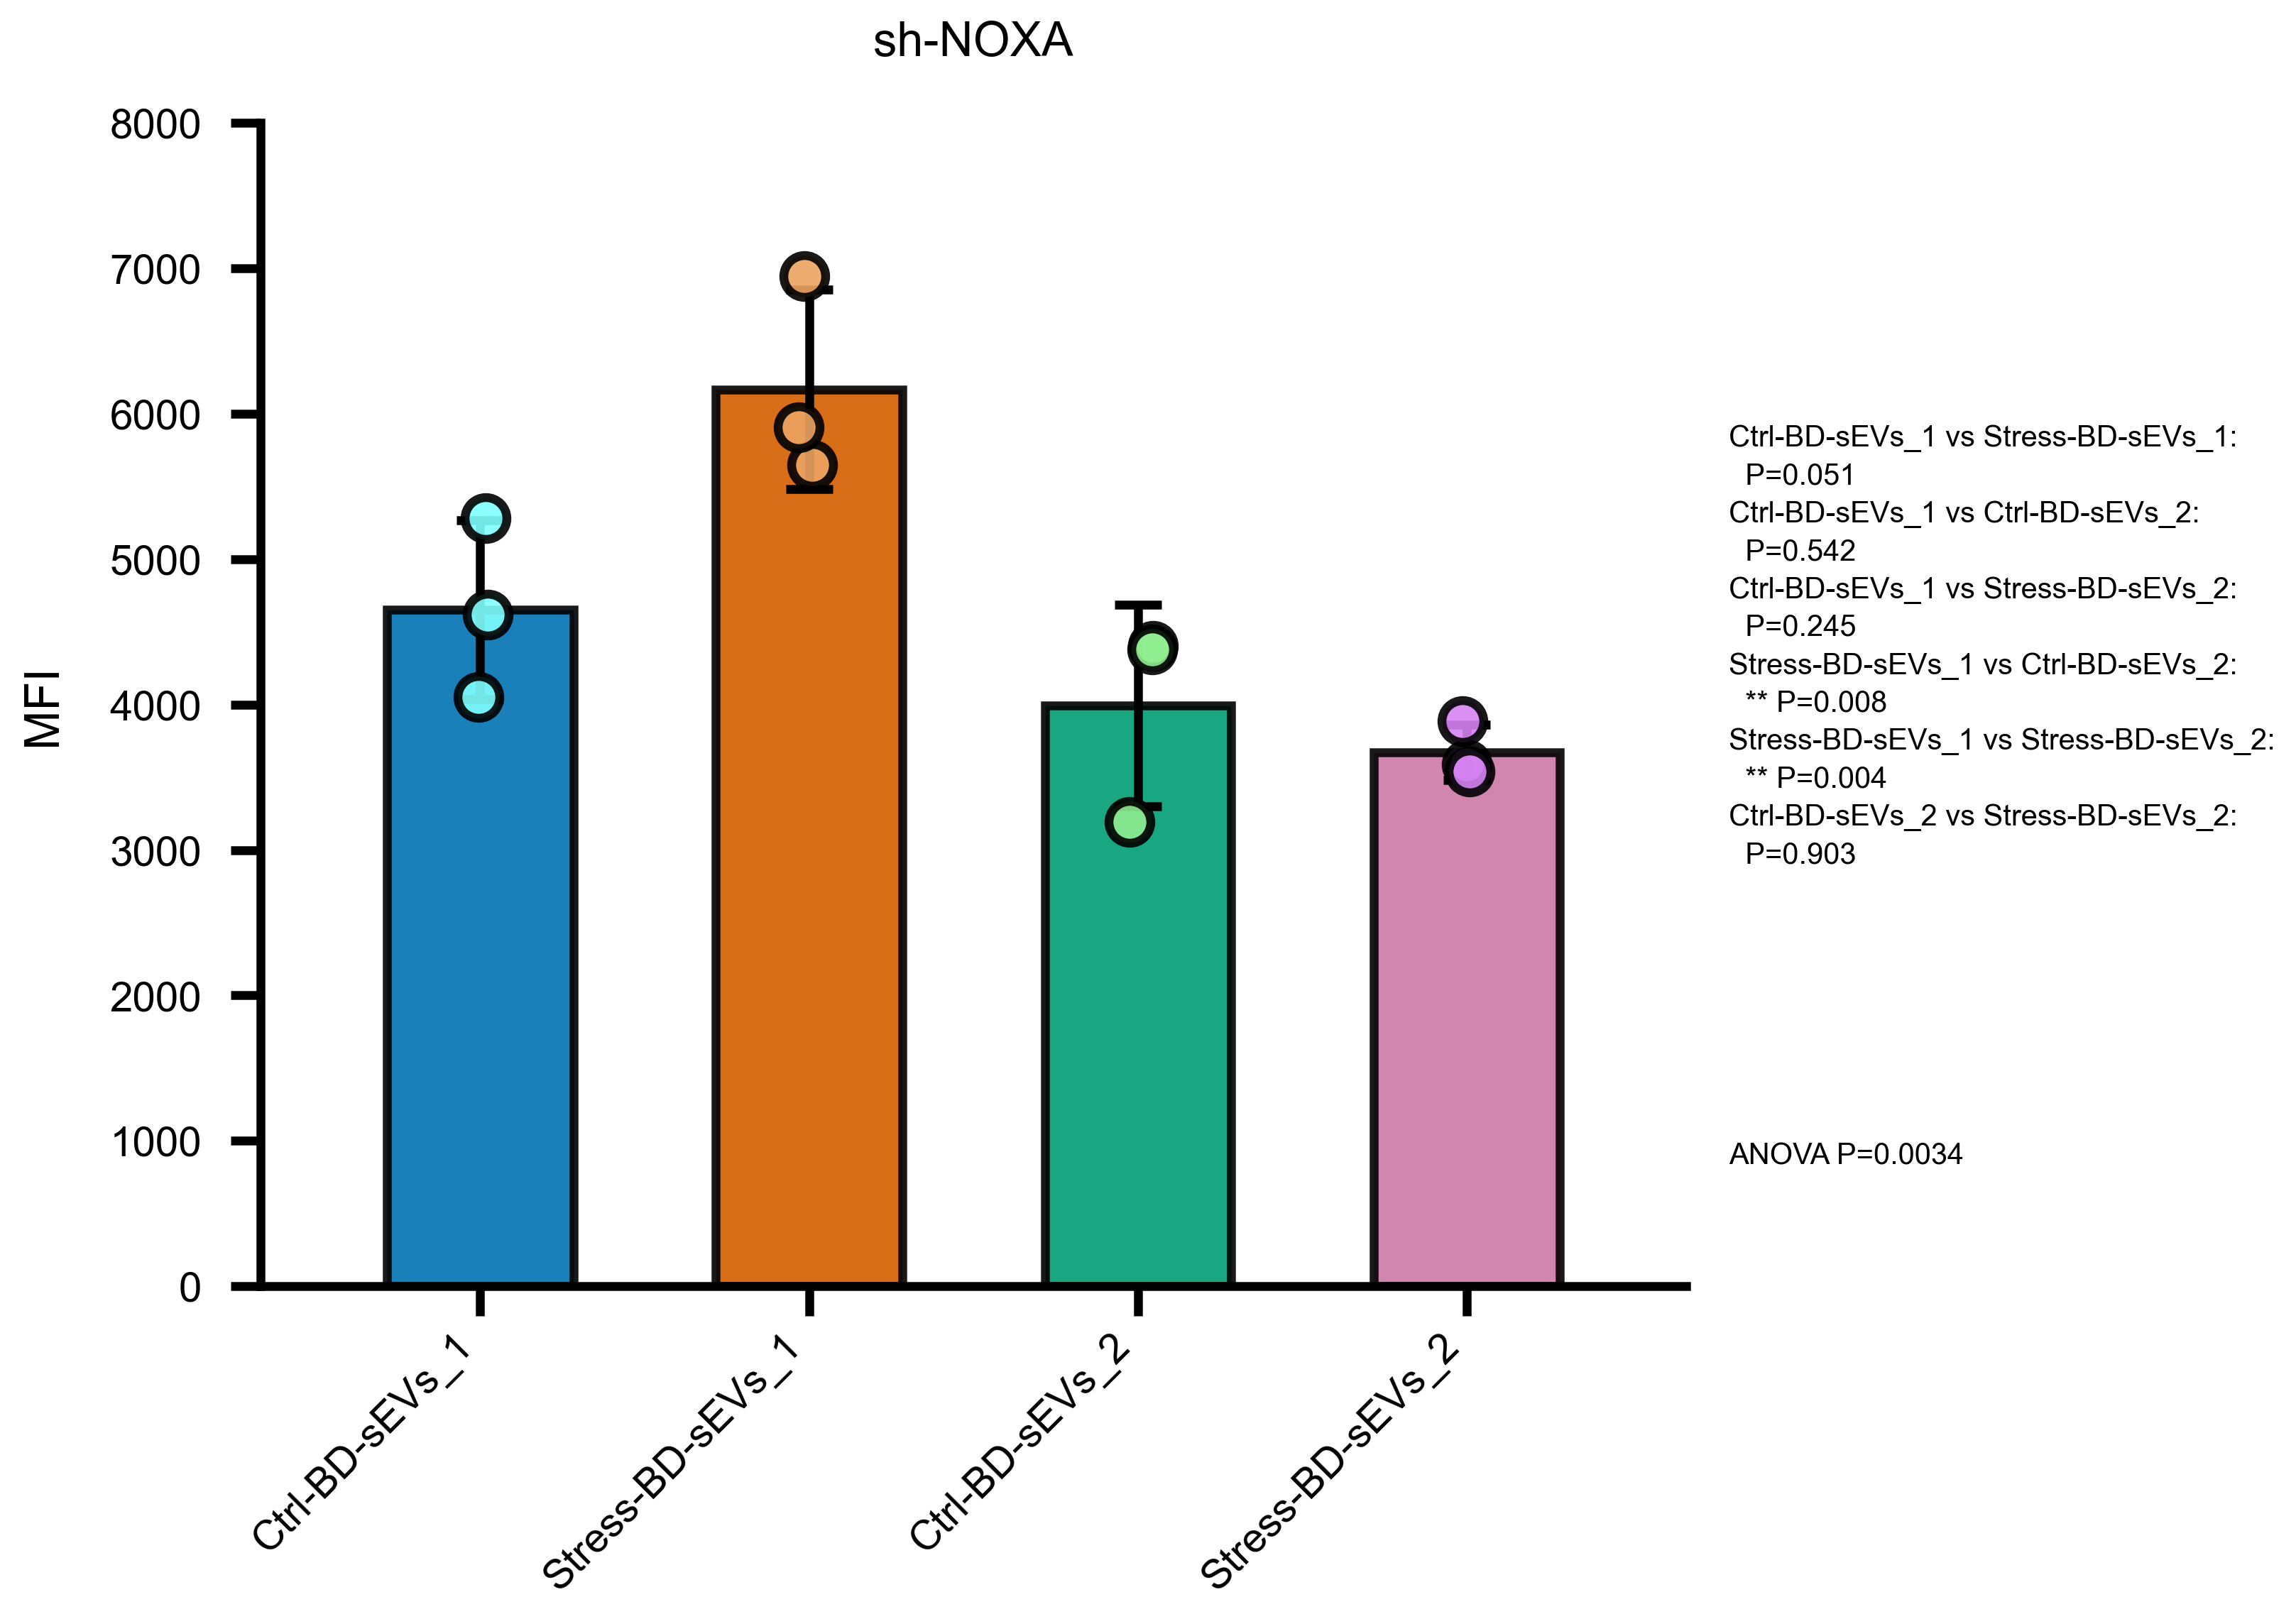
Counts the numeric columns in your CSV, auto-selects the matching 2/3/4/5/6-group script, and produces a 300-dpi PNG with mean, SD error bars, jittered replicate points and statistics (2 groups: t-test; ≥3 groups: ANOVA + Tukey HSD):
Quick start (30 seconds)
cd figure-generation/barplot
pip install pandas numpy scipy matplotlib statsmodels
python scripts/run_barplot.py examples/input/data.csv
The plot is saved next to the input as data_barplot.png.
Input format
Wide format — one column per group, one row per biological replicate:
Ctrl,Stress
18533,13055
20650,10017
19467,21995
Non-numeric columns are ignored automatically.
Output files
| File | Content |
|---|---|
<input>_barplot.png | 300-dpi grouped bar plot with statistics annotations |
Customization
Edit at the top of the selected script:
FIGURE_NAME = 'ELISA'
Y_LABEL     = 'IFNβ (pg/mL)'
bar_colors  = [...]   # Wong 2011 color-blind-friendly palette by default
Alternative palettes with identical statistics: barplot_2col_green_pink.py, barplot_3col_light.py.
Troubleshooting
- Wrong script picked → check for stray non-numeric header columns; or call the exact script directly.
- Labels cut off → the Y-axis auto-extends; if a custom range is needed, edit
Y_LABEL/axis settings in the script header. - Why must the agent run the bundled scripts instead of writing its own? The scripts in
scripts/are the tested path — they have been run on the example data, and their edge cases are documented. Code generated on the fly by an agent is the most common source of silently wrong results. If a case is not covered, change the CLI arguments first; if that is not enough, copy a script to a scratch directory and make a minimal, reported edit; only write new code when nothing covers the task, and fold it back intoscripts/afterwards.
Links
- Source & SKILL.md on GitHub
- Related skills: qPCR mRNA · Clinical tables