
Clinical Tables
One-line: patient-level CSV in — publication-ready three-line tables out. Fully validated on all 10 tables (Table 1–10 = manuscript Table 1/2 + Supplemental S1–S8) of a real CRE/CSE cohort study: baseline comparison, Firth regression, genotype cross-tabs, univariate analysis, sequencing-quality table.
Get this skill · 获取本技能
Option A — one-click agent prompt (recommended). Copy this into your AI agent IDE:
Please set up the "clinical-table" skill from the Claw2Bio library for me:
1. Fetch only the folder "figure-generation/clinical-table" from the GitHub repo
   https://github.com/nihuanhe/claw2bio (use sparse checkout; do not clone the whole repo).
2. Read its SKILL.md and register the skill.
3. Run the bundled example in examples/ to verify my environment, and show me the output tables.
Option B — standalone zip (~0.2 MB, served from this site): https://claw2bio.site/downloads/clinical-table.zip
Option C — full example dataset: already included in the Option B package above.
What it does
Generic engine (Python, zero setup): two-cohort baseline table — categorical n (%) + Pearson χ² (Fisher's exact when any expected cell < 5) + continuous mean ± SD + Student's t-test; plus correlation matrix, Cox regression, OR summary.
Full manuscript table suite (R pipeline): 9 R scripts + 1 Python script in scripts/pipeline/; run in order to reproduce a paper's complete table set (Table 1–10 = manuscript main-text Tables 1–2 + supplemental S1–S8) from patient-level CSVs — baseline, Firth penalized logistic regression, resistance-gene/sequence-type/plasmid-replicon cross-tabs, univariate analysis, isolate sequencing-quality table.
Output is Markdown three-line tables, convertible to DOCX with Pandoc (pandoc output.md -o output.docx).
Example output (all 10 tables of a real cohort study, click to switch)
All ten figures below were produced by the skill's R pipeline from the pseudonymized patient-level data of a real CRE/CSE cohort study (manuscript under review); every cell was reconciled against the authors' independent recalculation scripts:
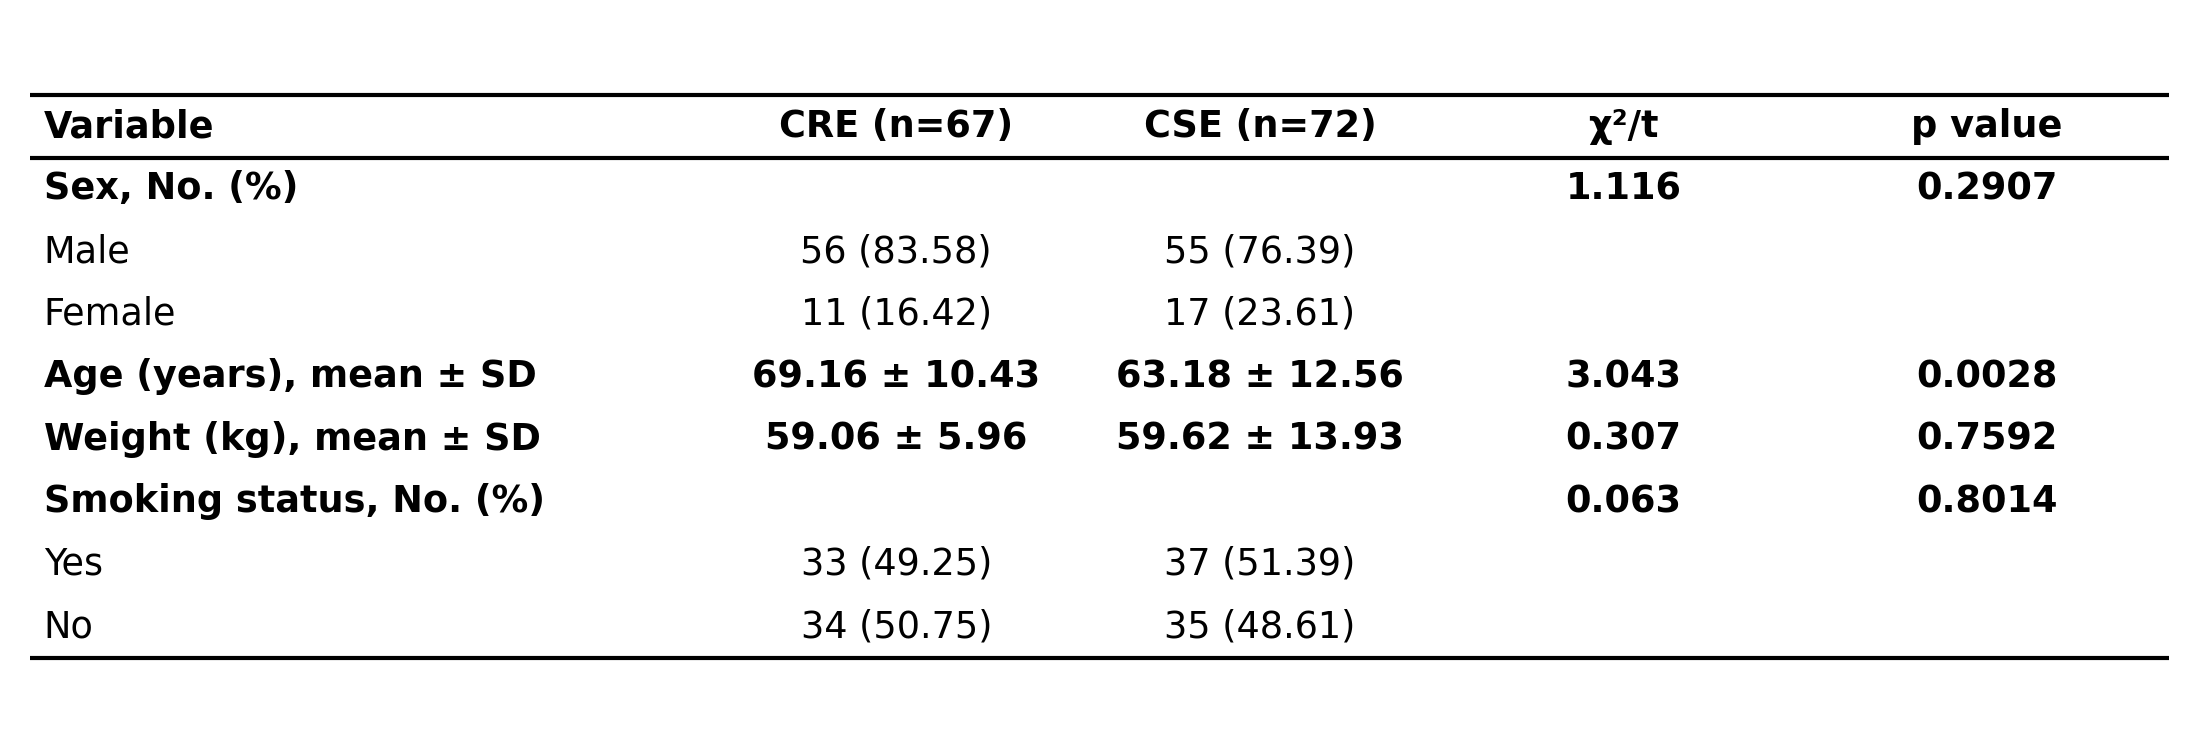
Table 1 · Baseline (= manuscript Table 1) · CRE (n=67) vs CSE (n=72) baseline characteristics: categorical χ²/Fisher + continuous Student's t. Age 69.16±10.43 vs 63.18±12.56 (p=0.0028); Sex p=0.2907. For hospital stay / intubation etc. see Table 2 and Table 8.
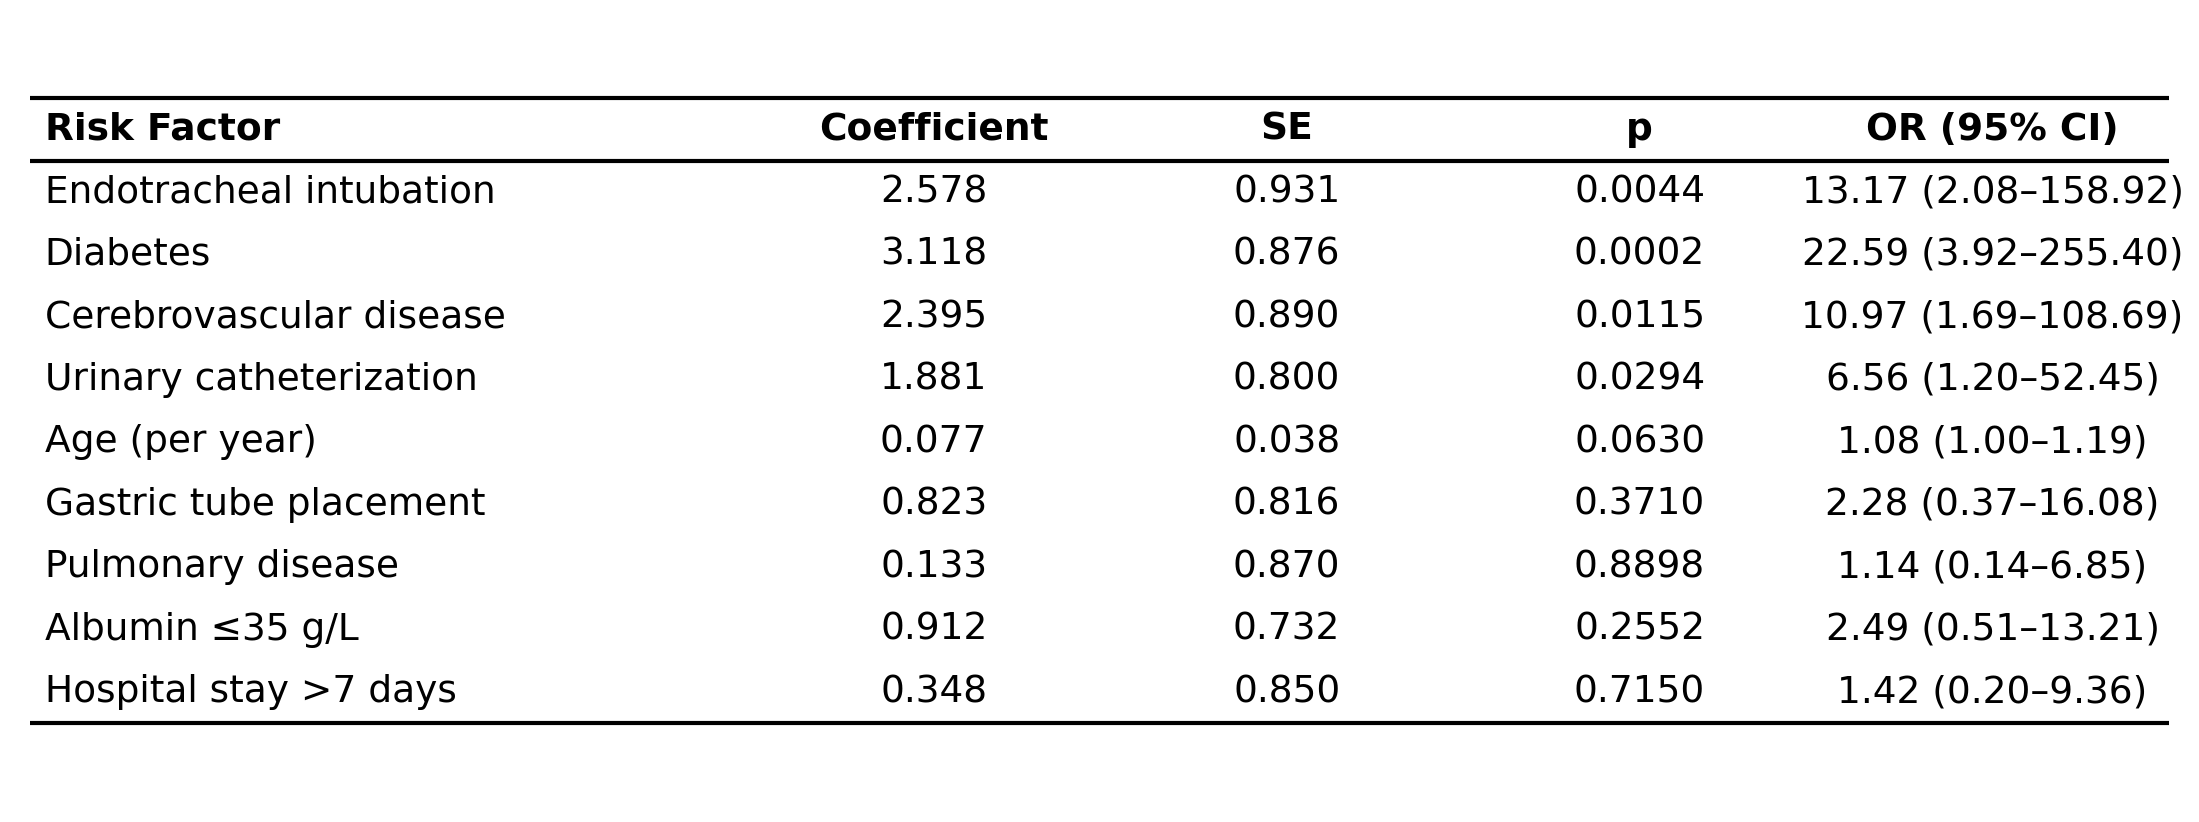
Table 2 · Firth (= manuscript Table 2) · Firth penalized multivariable logistic regression (CRE vs CSE, 9 covariates): robust inference for rare events, OR (95% CI) per row.
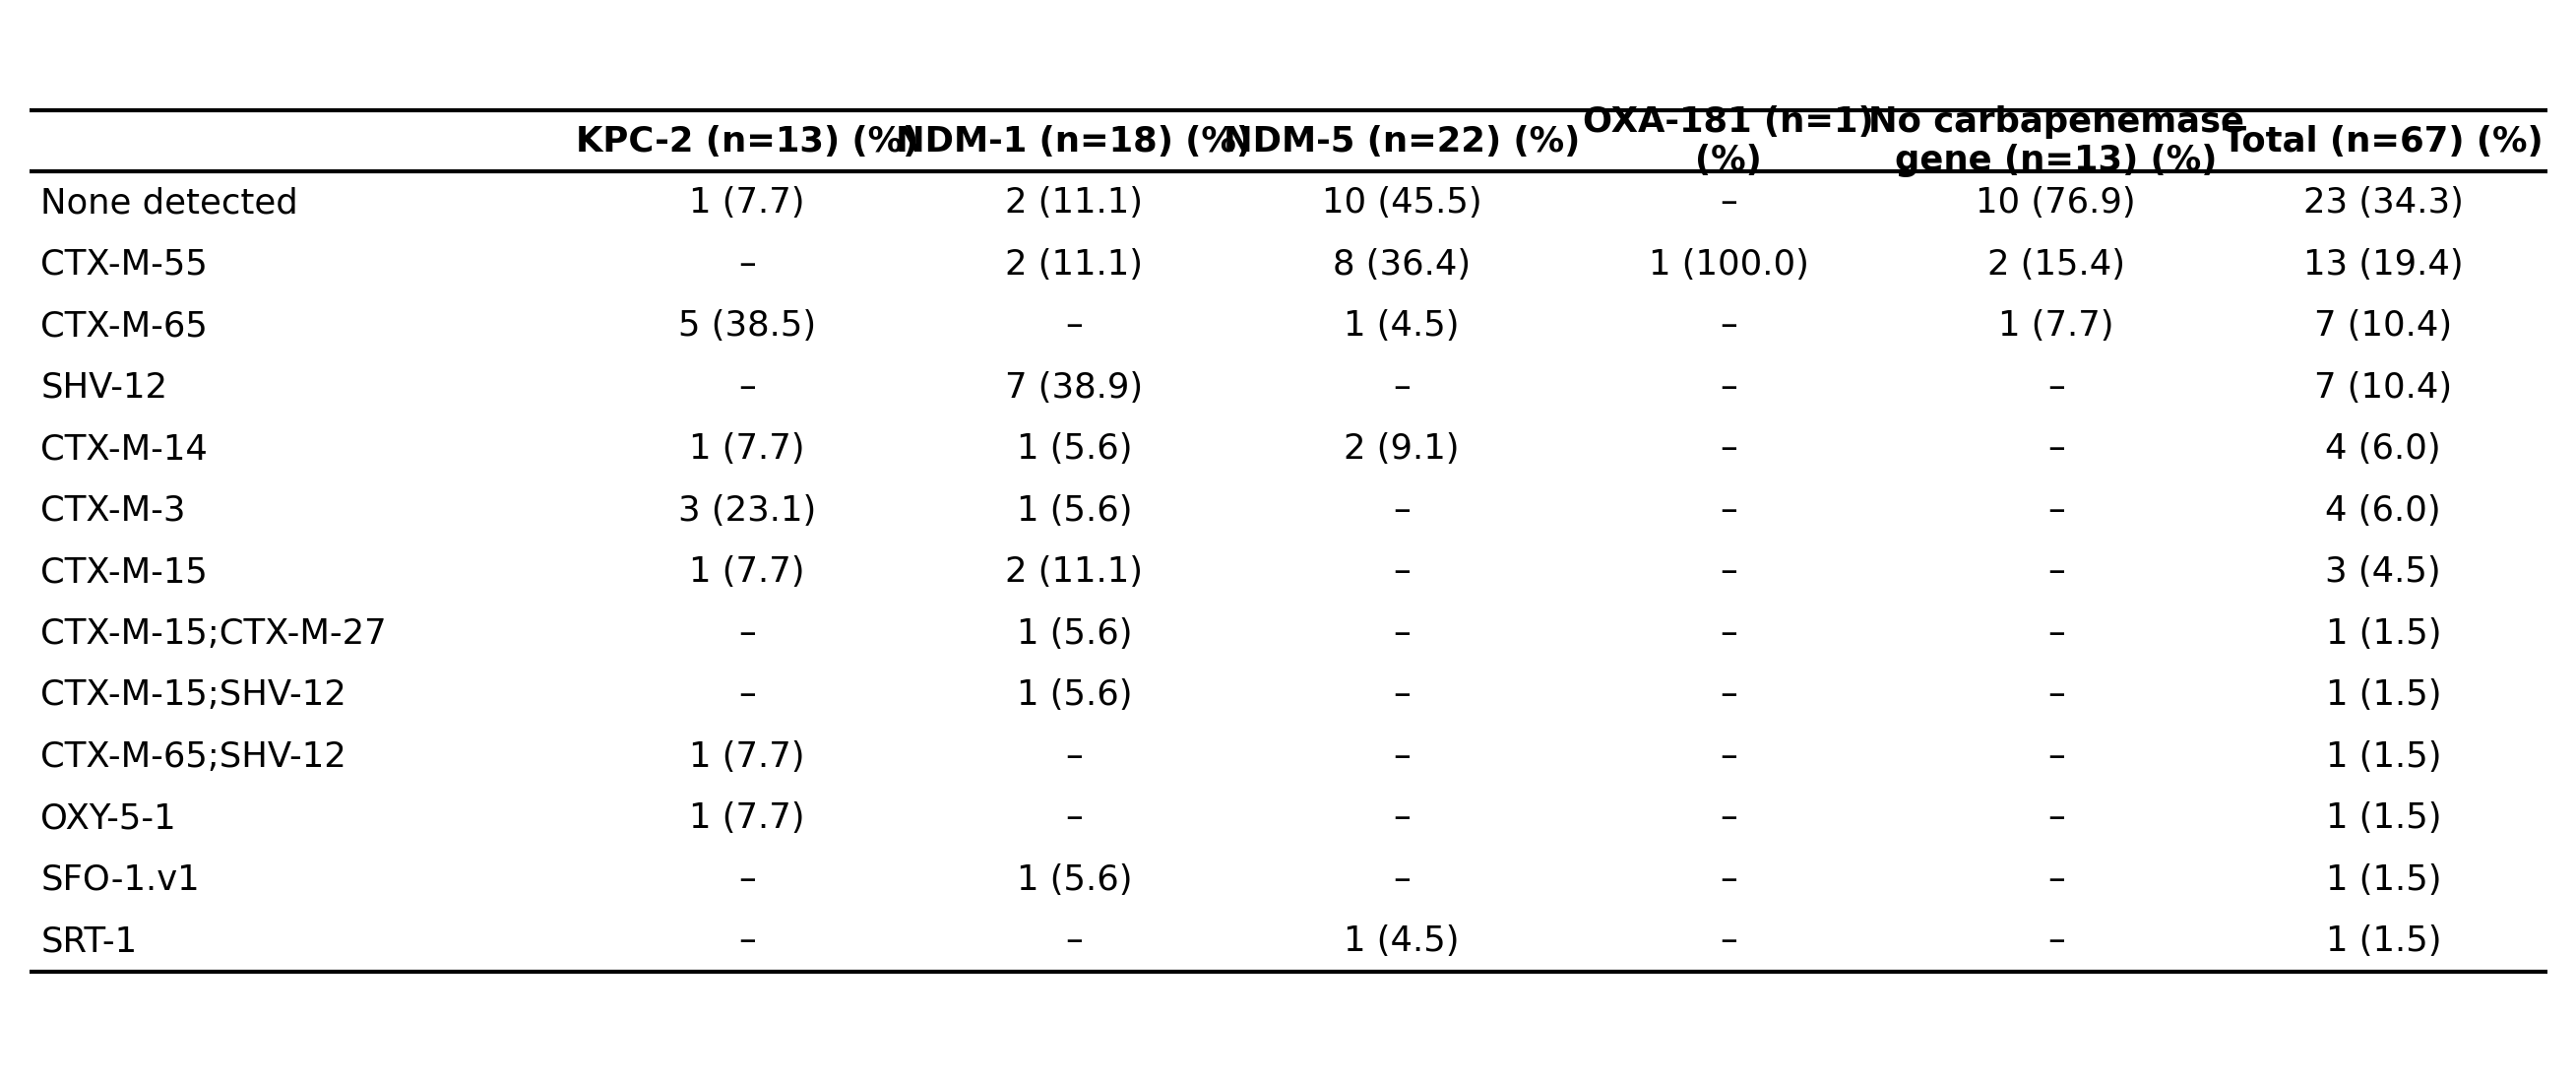
Table 3 · ESBL genes (= manuscript Supplemental Table S1) · Additional β-lactamase gene combinations in CRE isolates × carbapenemase groups (n (%), Kleborate flags stripped).
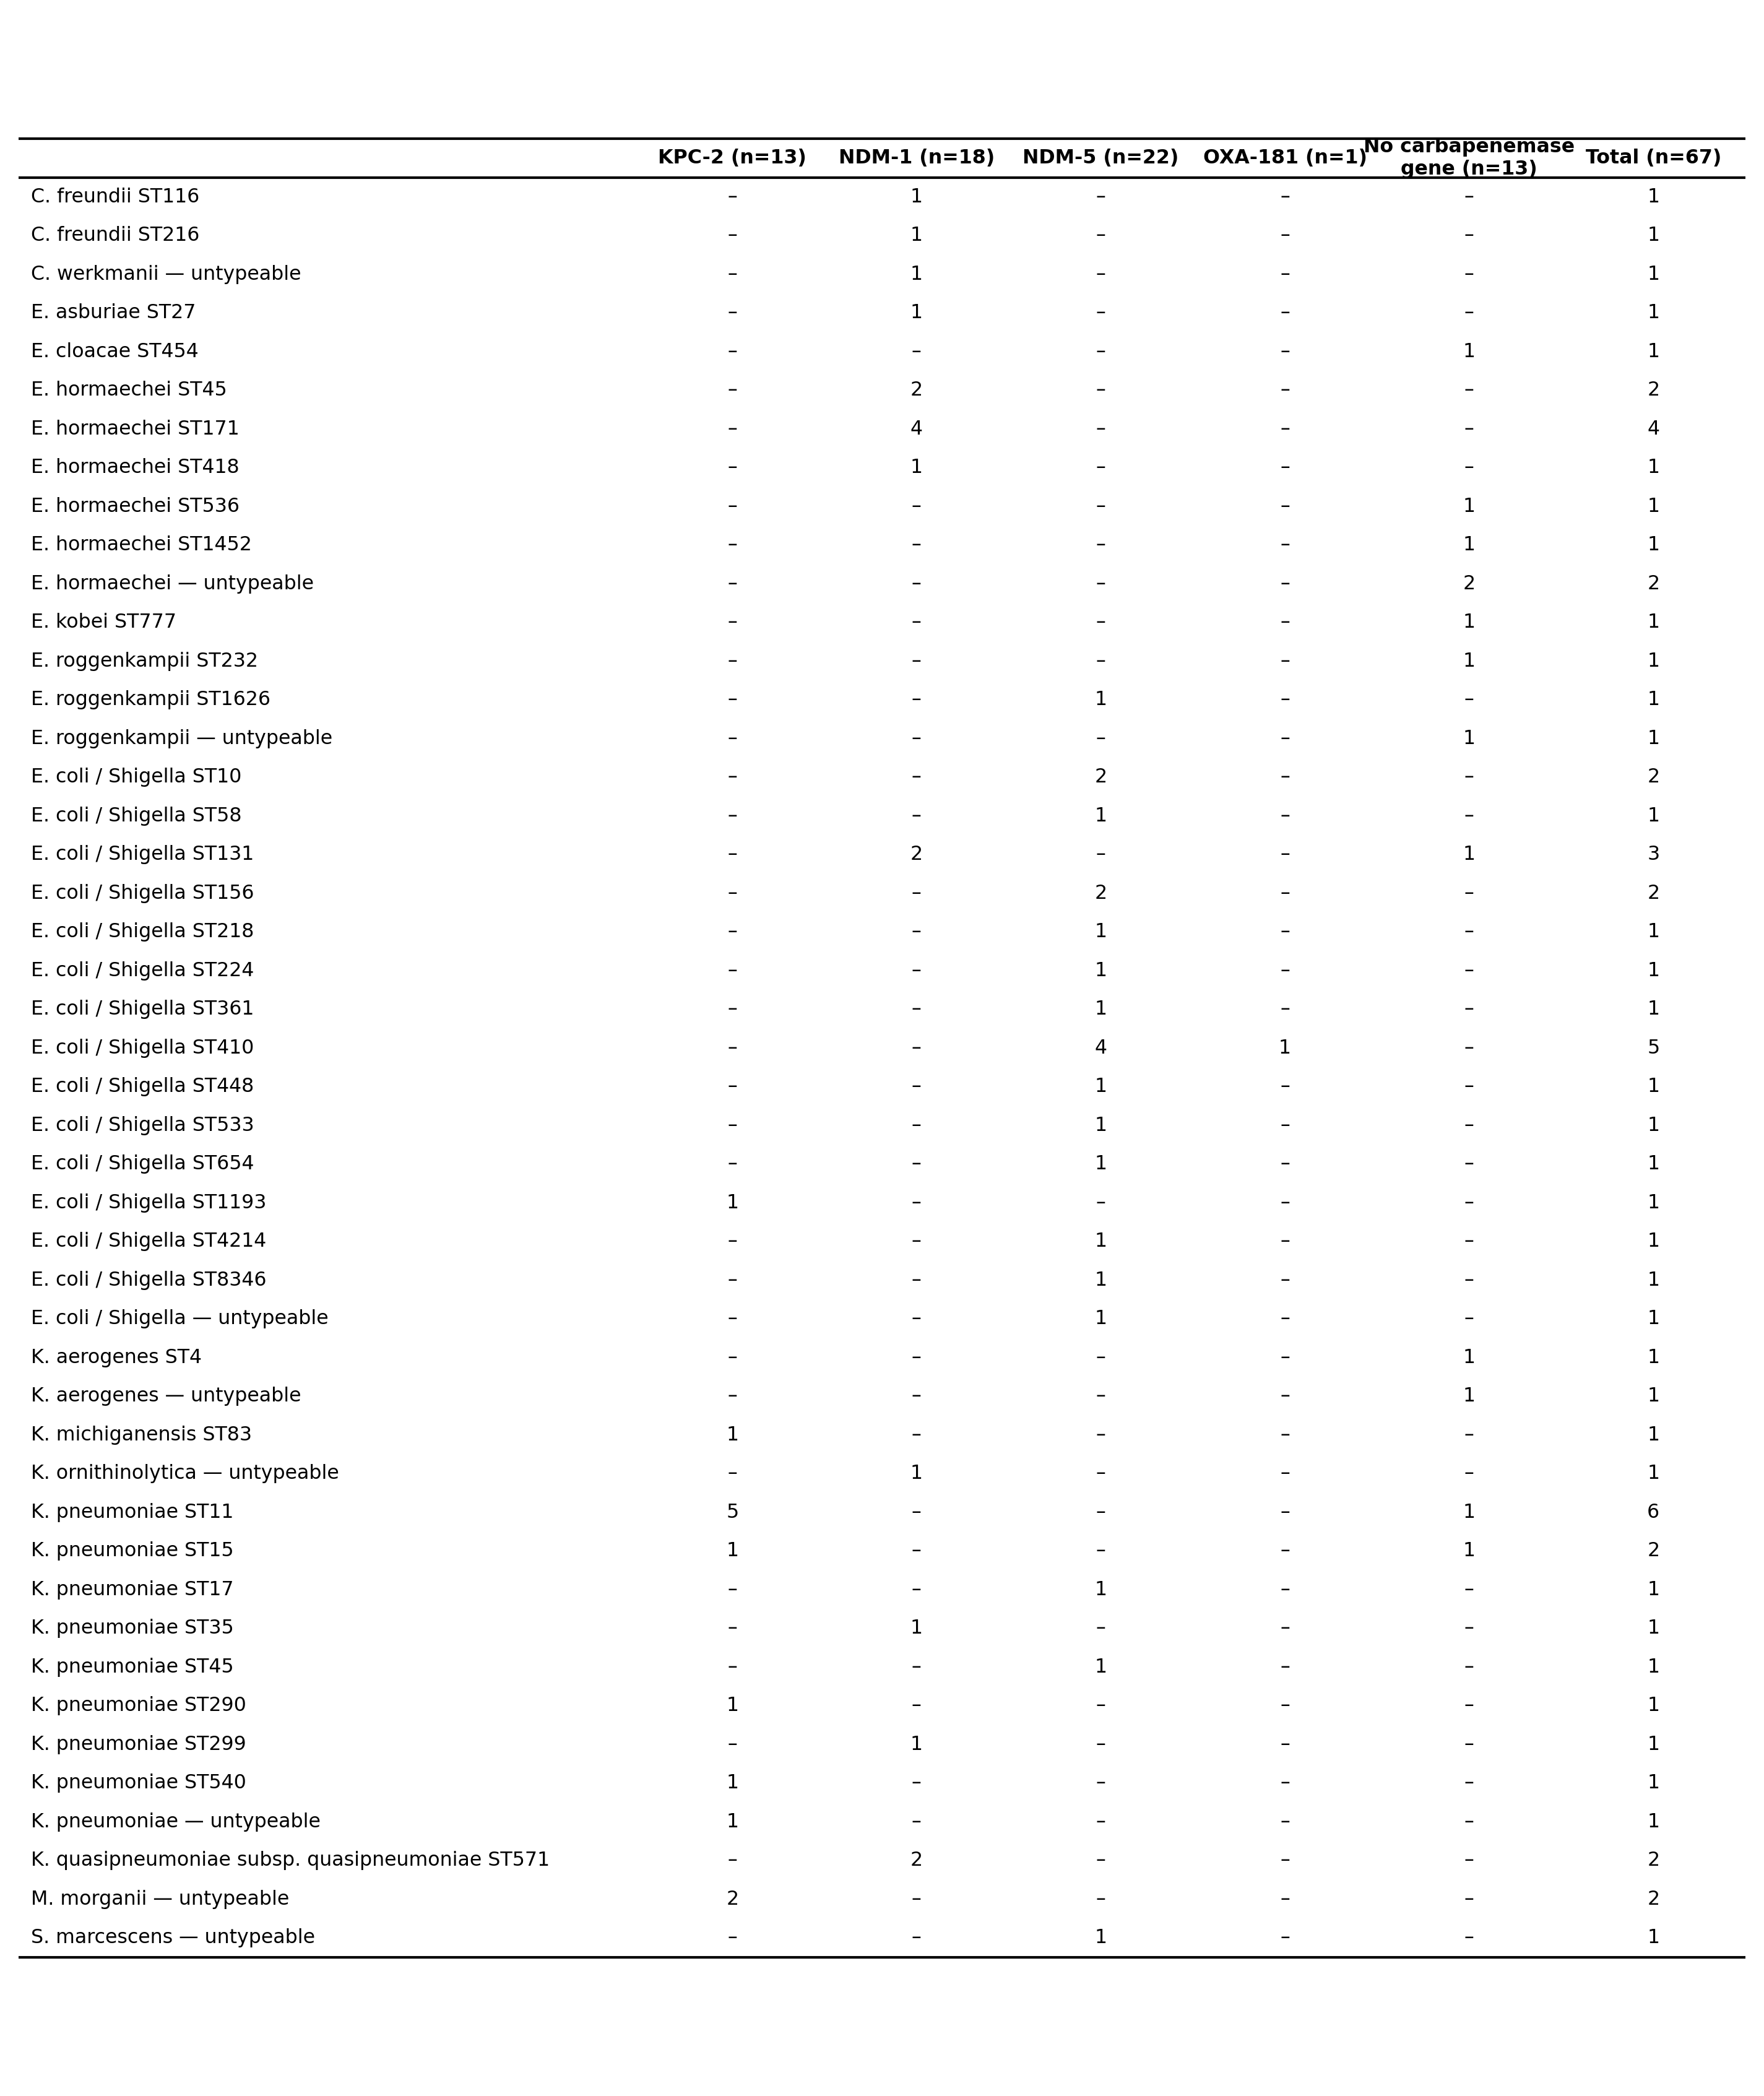
Table 4 · Sequence types (= manuscript Supplemental Table S2) · Species–ST combinations of CRE isolates × carbapenemase groups (46 rows, per-species untypeable rows).
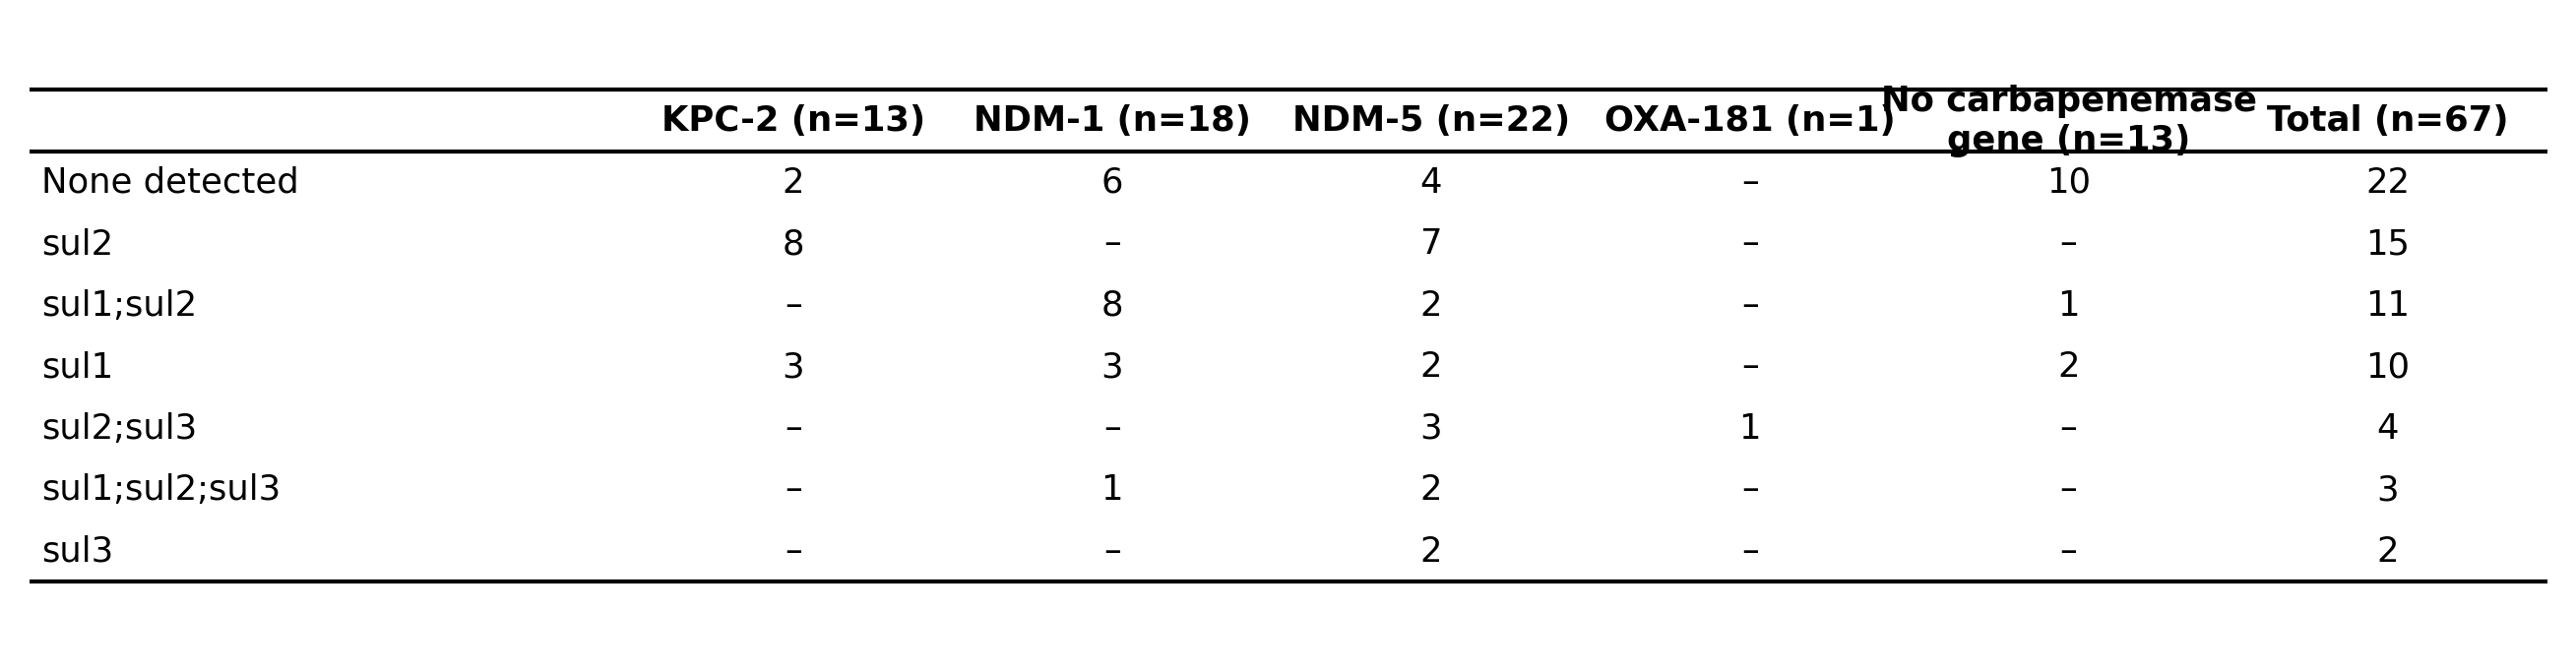
Table 5 · sul genes (= manuscript Supplemental Table S3) · Sulfonamide resistance gene (sul) combinations × carbapenemase groups.

Table 6 · Disease × genotype (= manuscript Supplemental Table S4) · Underlying disease distribution across CRE genotypes (diabetes / cerebrovascular / pulmonary disease).
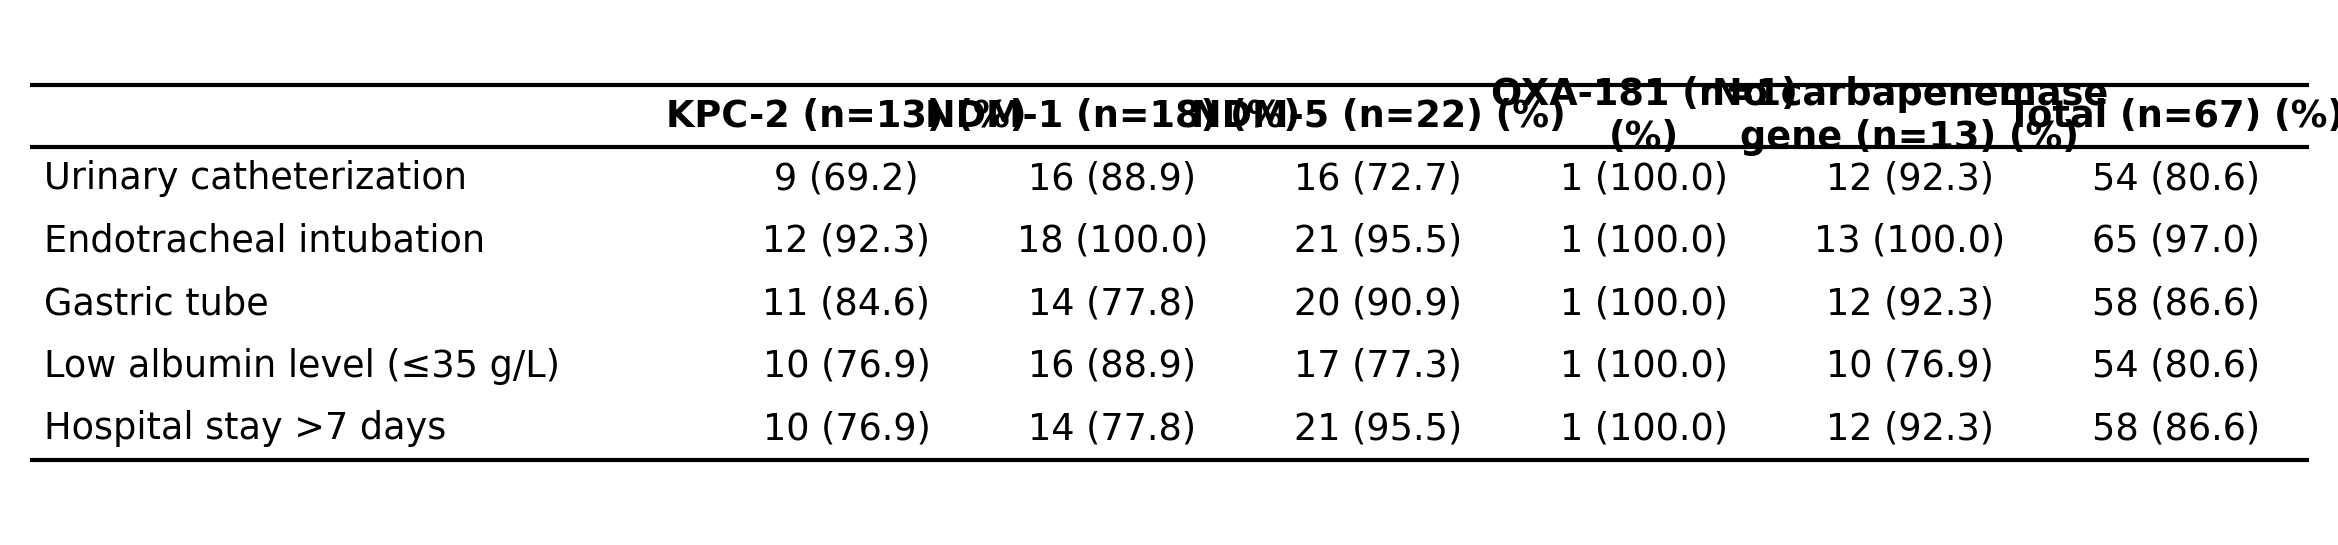
Table 7 · Procedures × genotype (= manuscript Supplemental Table S5) · Invasive procedures, albumin level, and hospital length of stay across CRE genotypes.
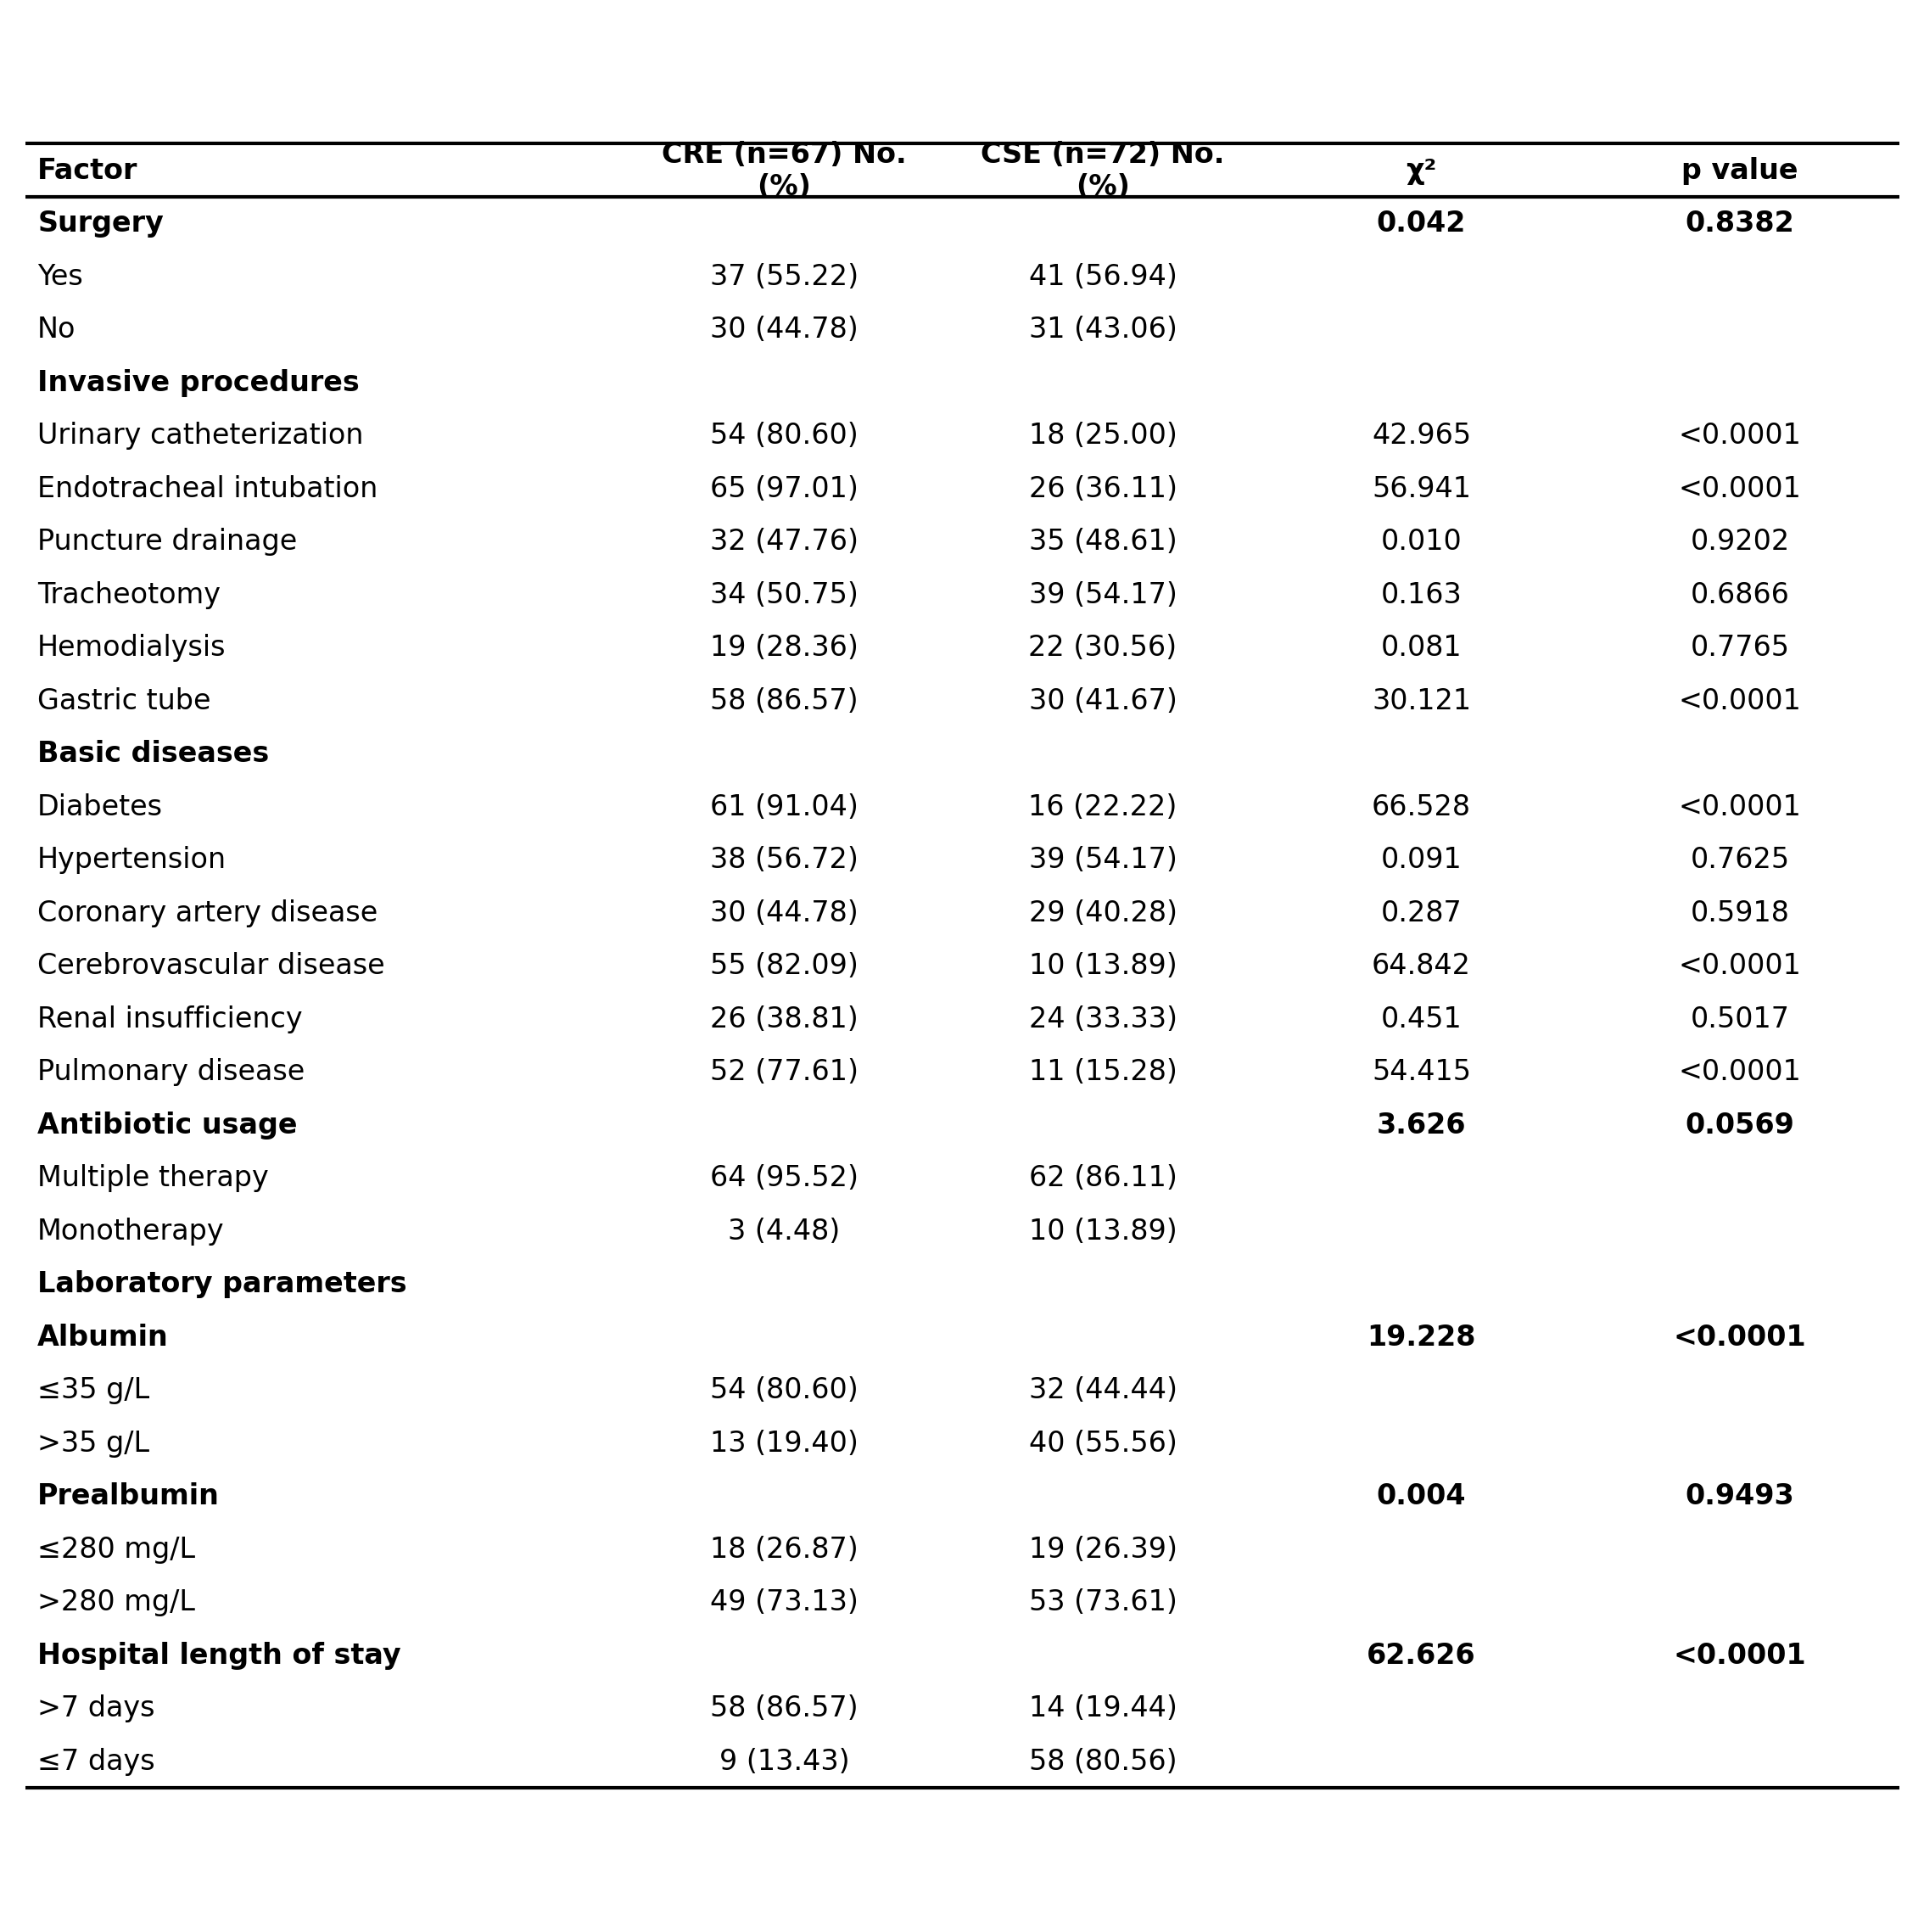
Table 8 · Univariate (= manuscript Supplemental Table S6) · Univariate analysis of factors associated with CRE infection (30 rows, χ²/Fisher auto-switch).
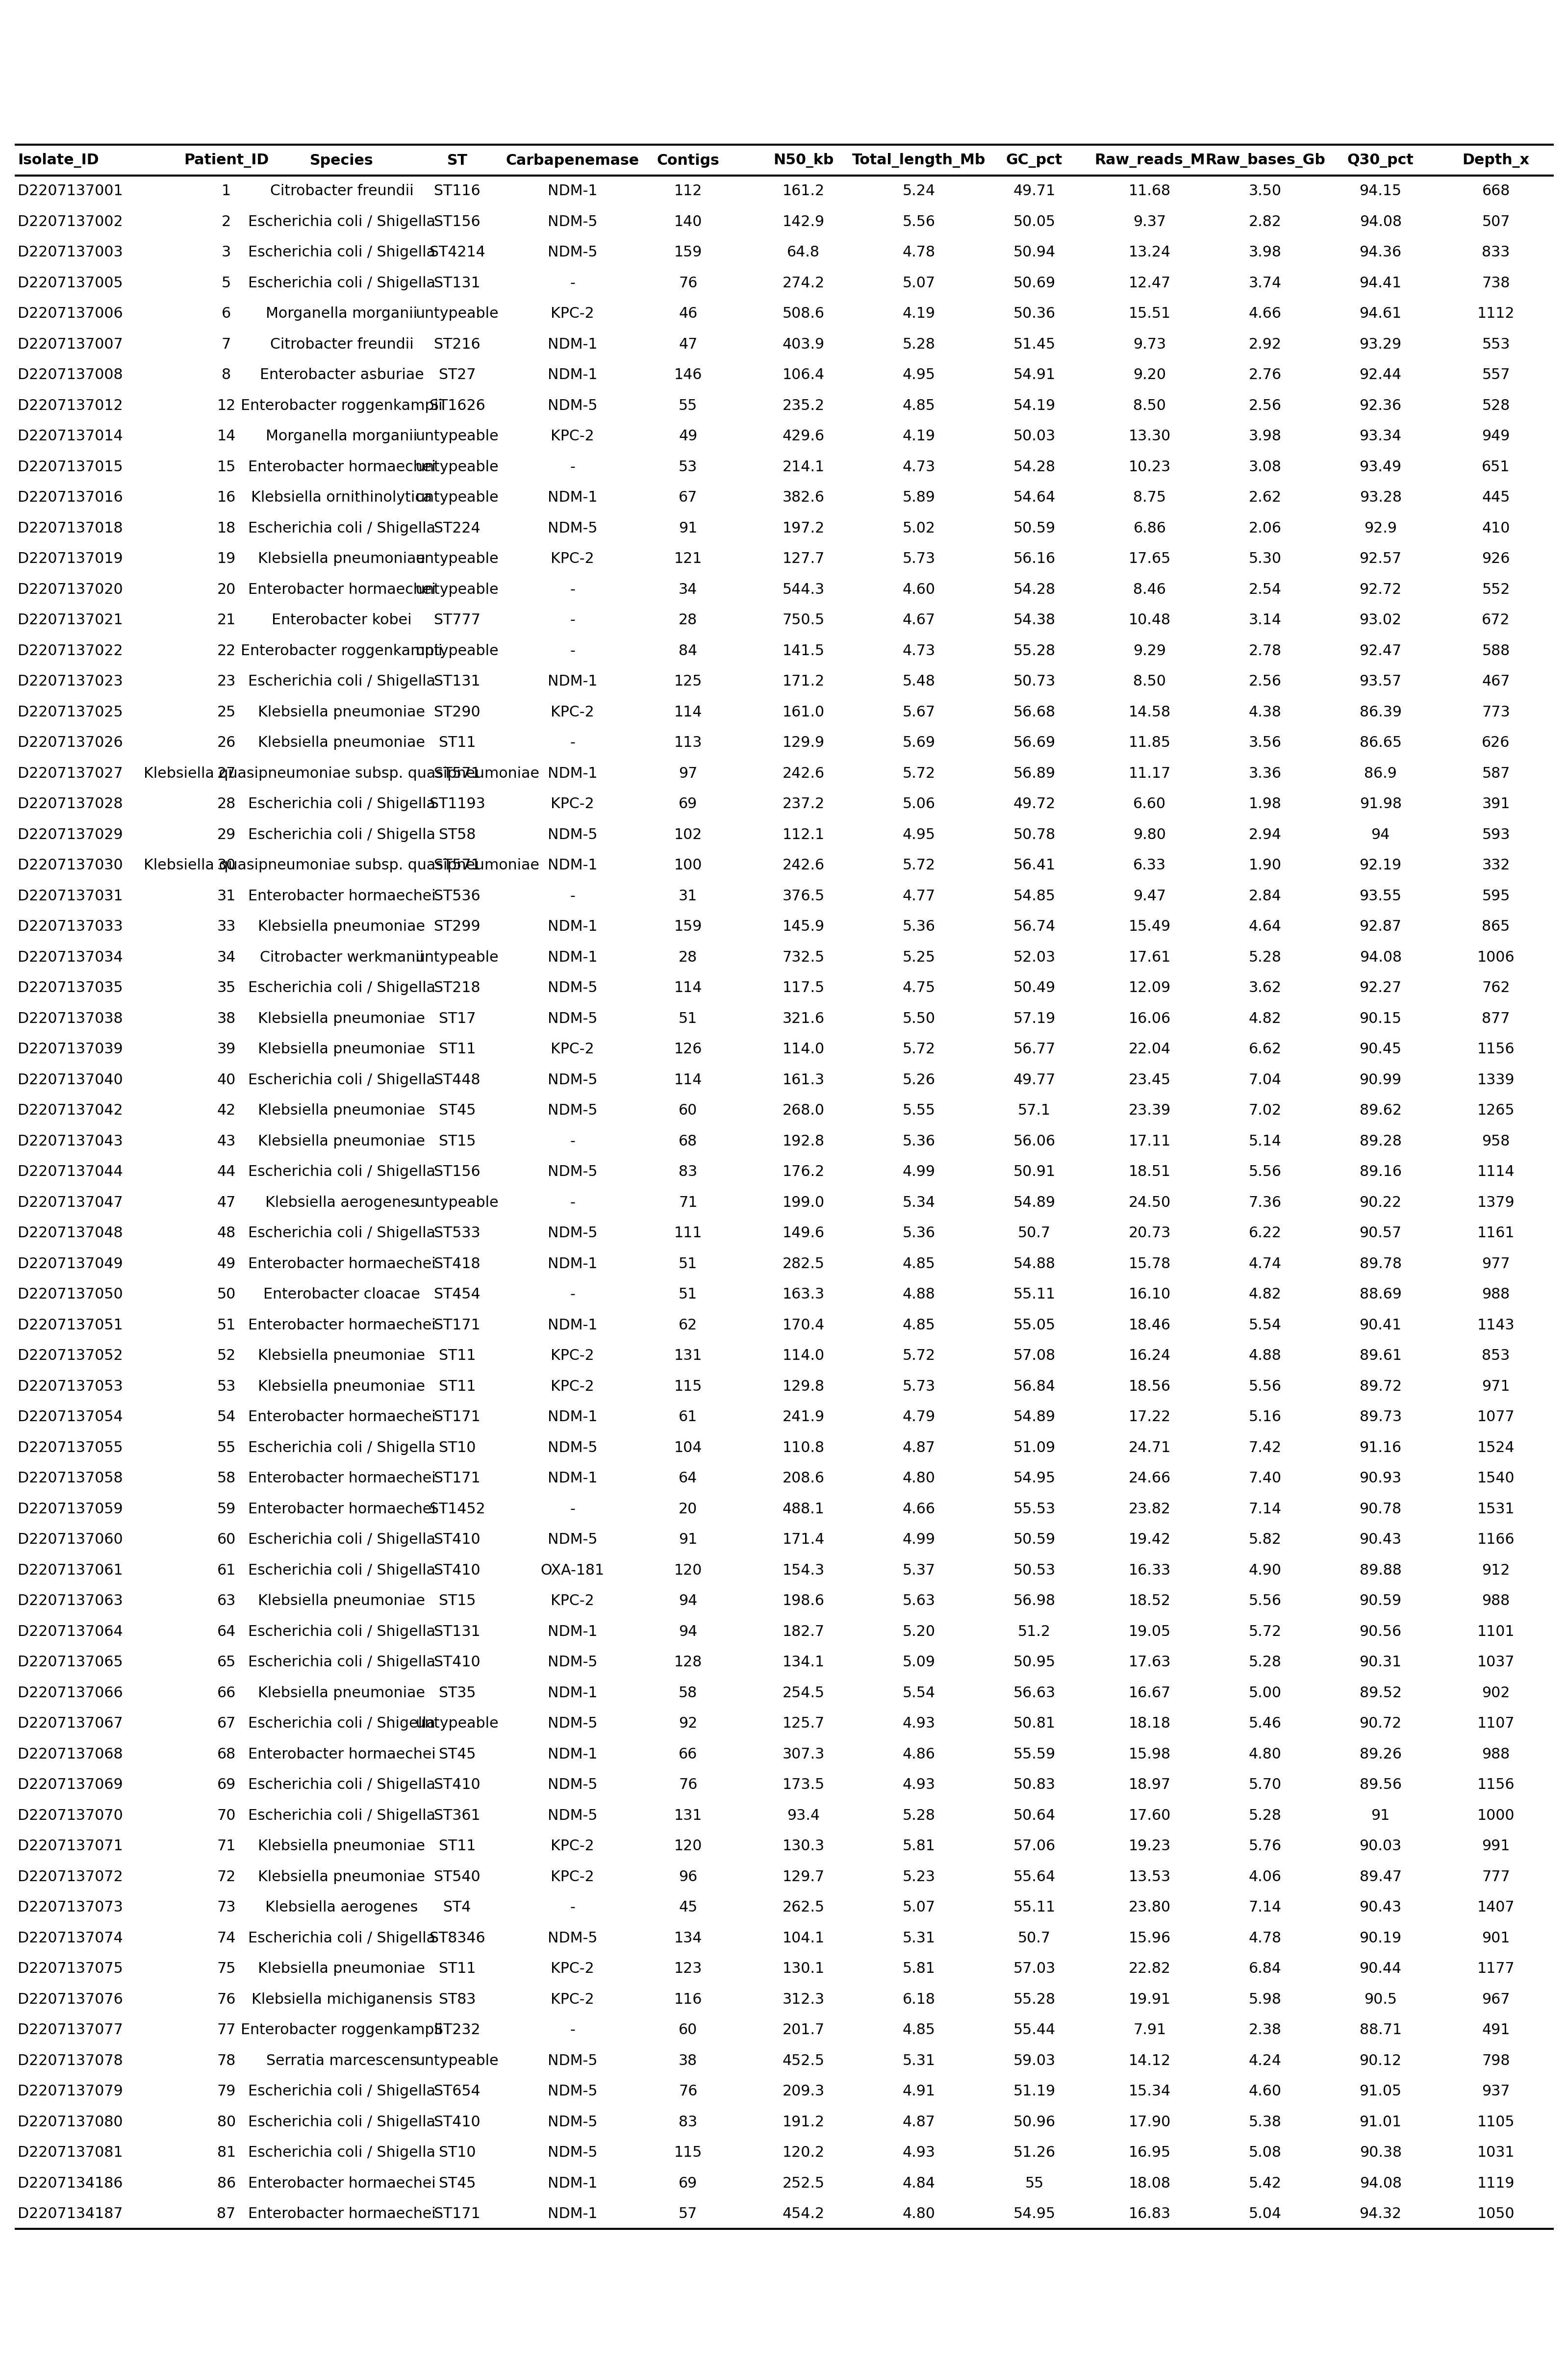
Table 9 · Sequencing quality (= manuscript Supplemental Table S7) · Sequencing quality metrics of the 67 CRE isolates (contigs/N50/GC/throughput/depth; standalone CSV).
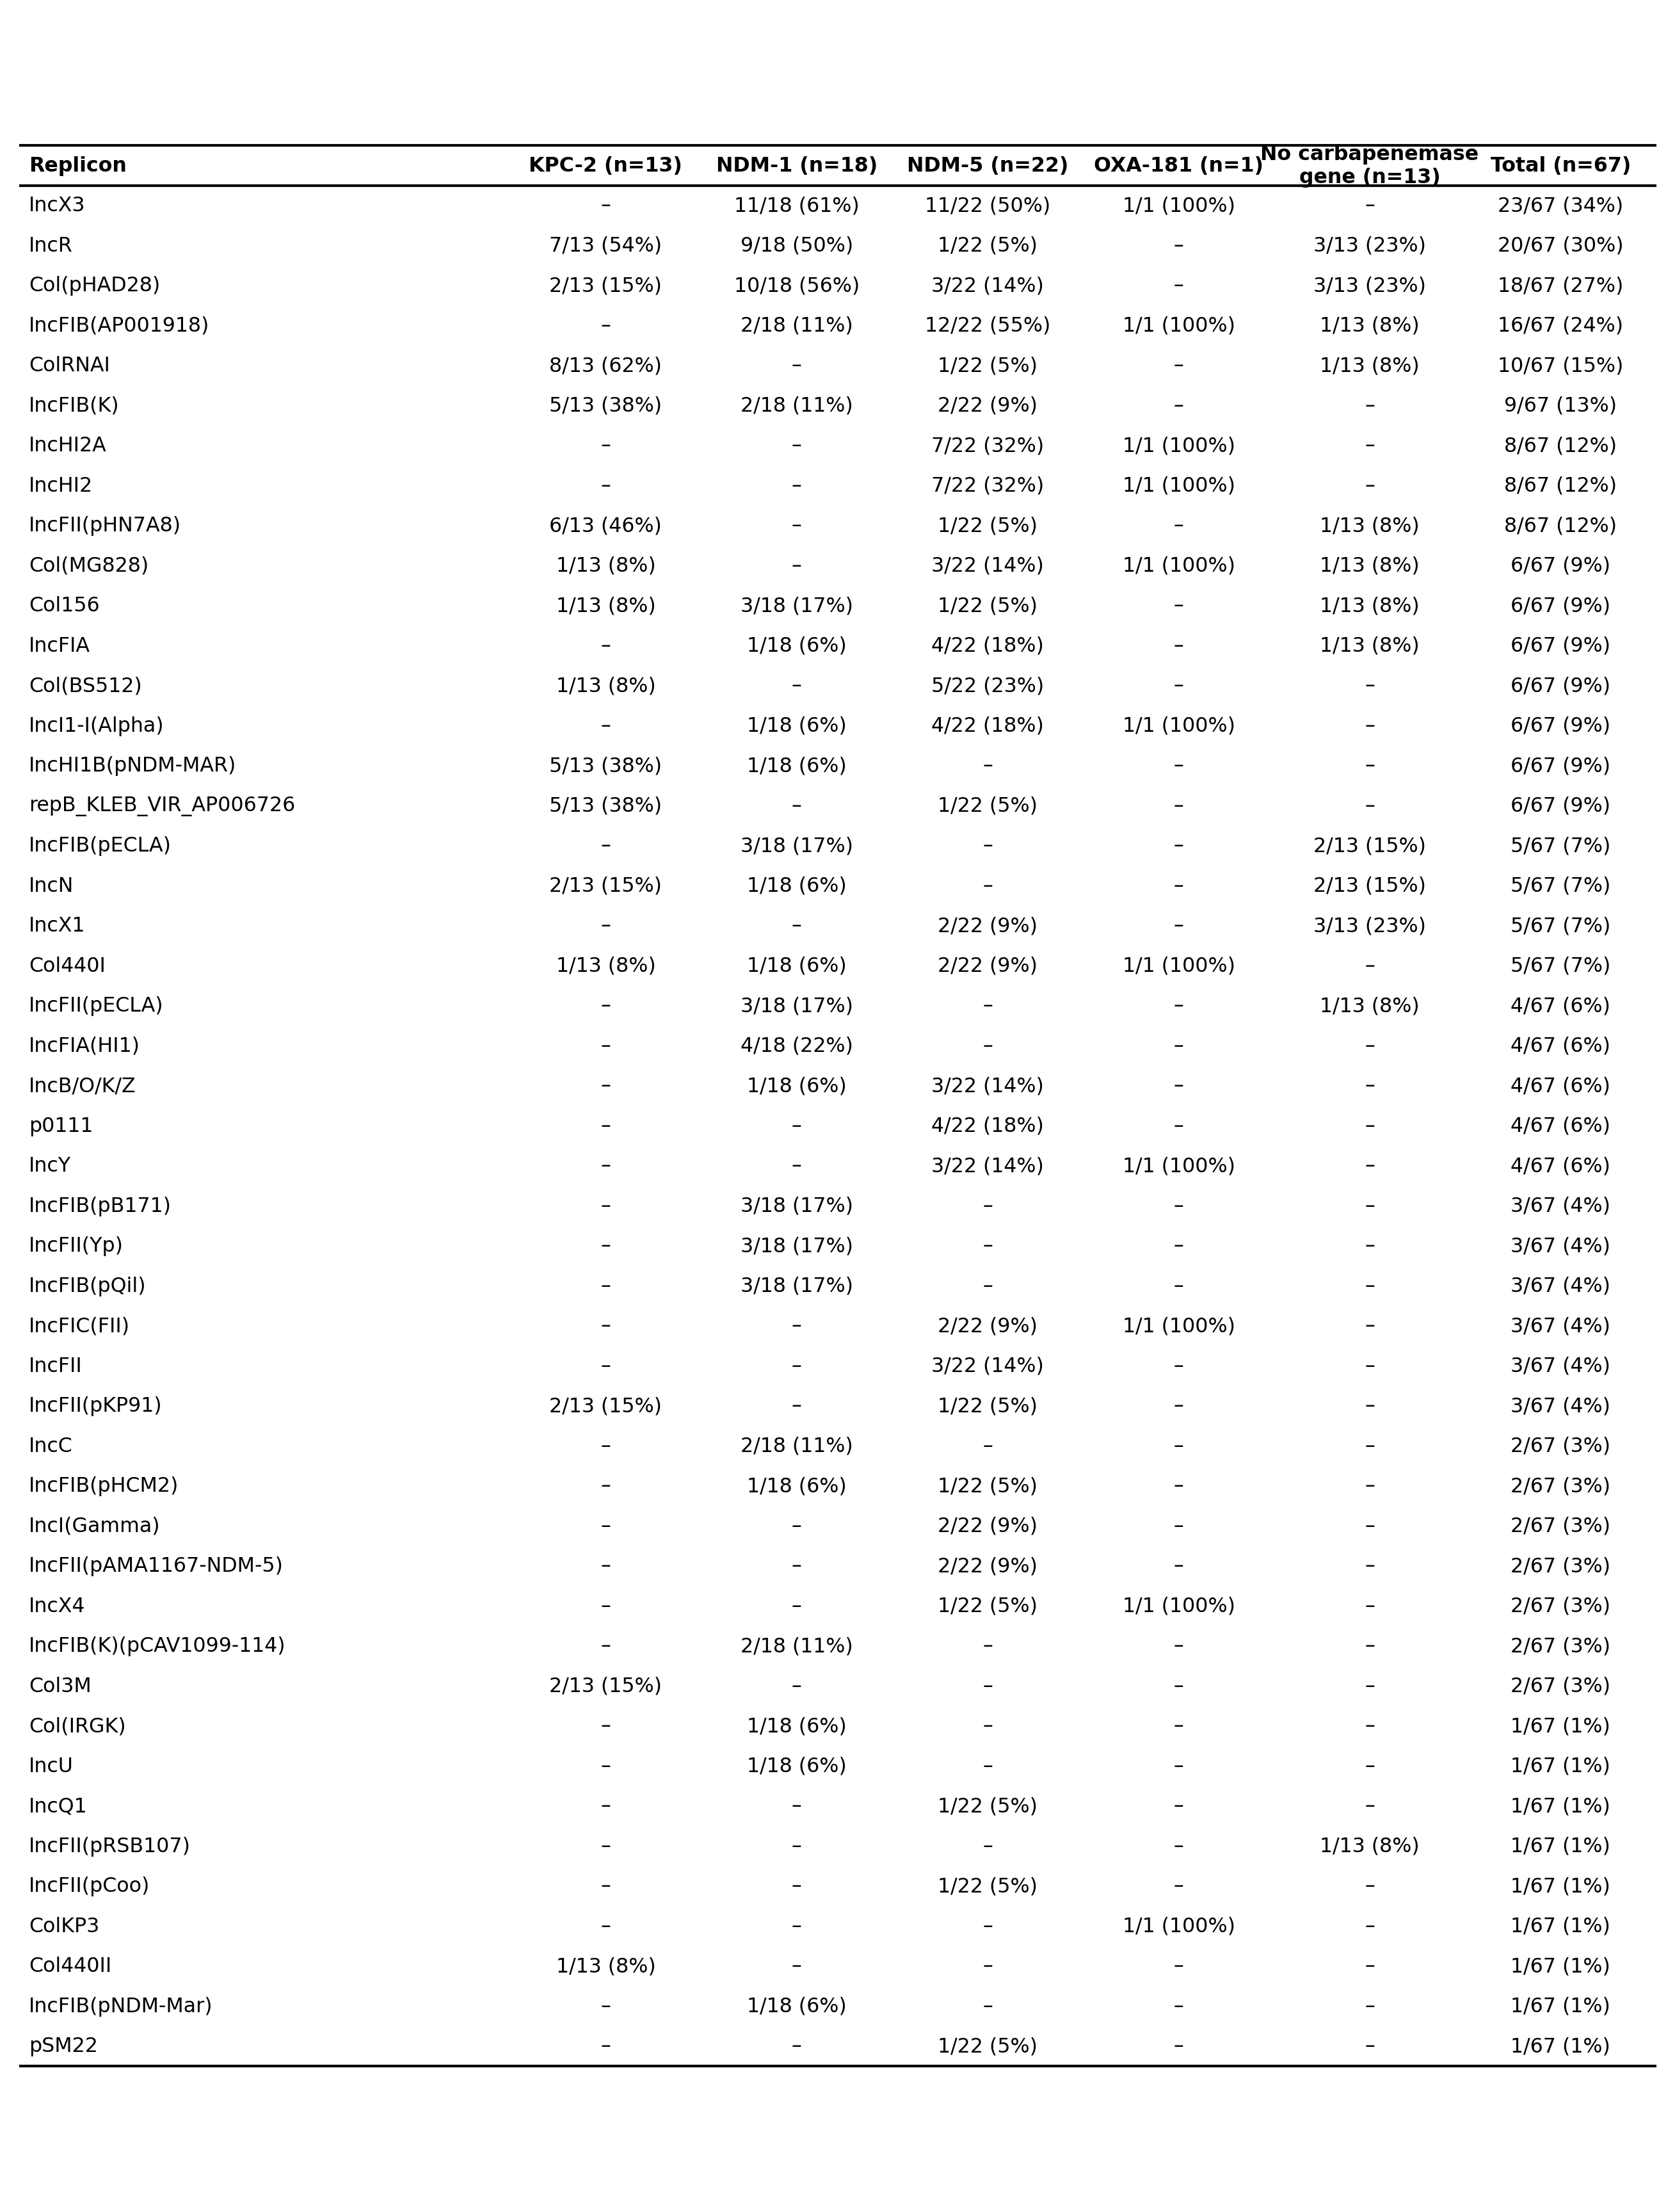
Table 10 · Plasmid replicons (= manuscript Supplemental Table S8) · Plasmid replicon carriage by carbapenemase group (Kleborate/PlasmidFinder, 47 rows).
Quick start (30 seconds, generic engine)
cd figure-generation/clinical-table
pip install pandas numpy scipy statsmodels
python scripts/clinical_table.py examples/input/clinical_cohorts.csv examples/output/clinical_tables.md
Expected anchors: CRE n=67, CSE n=72; Age 69.16±10.43 vs 63.18±12.56, p=0.003.
Quick start (R pipeline, full manuscript table suite)
Requires R with the logistf package (Table 2). Put the two pseudonymized CSVs and the Table-all.md skeleton in one folder and run in order:
cd examples/input/pipeline   # both CSVs and the Table-all.md skeleton live here
Rscript ../../scripts/pipeline/table1_baseline.R    # fills the Table 1 block of Table-all.md
Rscript ../../scripts/pipeline/table2_firth.R       # Firth regression
Rscript ../../scripts/pipeline/table3_esbl_genes.R  # then Tables 3–8 and 10 in order
python ../../scripts/pipeline/make_table9_sequencing_quality.py   # Table 9 writes a standalone CSV
Each script: read CSV → compute → fill its block in Table-all.md → write a standalone CSV. Full anchor list in examples/output/pipeline/REPORT.md.
Input format
- Generic engine: patient-level CSV (one row per patient): a two-level grouping column (default
cohort) + 0/1 binary columns + continuous columns; configure viaDEFAULT_CONFIGor--config your.json. - R pipeline: one CSV per cohort (column structure shown in examples/input/pipeline/); the bundled example IS the pseudonymized real data — prepare your own data with the same column layout.
Output files
| File | Content |
|---|---|
clinical_tables.md (generic engine) | baseline / correlation / Cox / OR three-line tables |
Table-all.md (R pipeline) | the complete filled manuscript table set (224 lines) |
table1_baseline.csv … table10_plasmid_replicons.csv | standalone CSV per table (Table 9 = table9_sequencing_quality.csv) |
Troubleshooting
- p values differ from SPSS → this skill uses Pearson χ² WITHOUT continuity correction (publication Table-1 convention).
- R scripts crash on Windows → keep comments ASCII/English (the bundled scripts already are); if you edit comments yourself, save as UTF-8 without BOM or run
Rscript --encoding=utf-8. - logistf missing →
install.packages("logistf"). - Continuous variable missing from the baseline table → add it to
baseline_continuous_varsinDEFAULT_CONFIG. - Cox table absent → only appears when both
survival_timeandsurvival_eventcolumns exist. - Why must the agent run the bundled scripts instead of writing its own? The scripts in
scripts/are the tested path — they have been run on the example data, and their edge cases are documented. Code generated on the fly by an agent is the most common source of silently wrong results. If a case is not covered, change the CLI arguments first; if that is not enough, copy a script to a scratch directory and make a minimal, reported edit; only write new code when nothing covers the task, and fold it back intoscripts/afterwards.
Links
- Source & SKILL.md on GitHub
- Related skills: Kaplan-Meier curve